
Today’s world screams for scenario planning.
Think about tariffs, Covid, supply disruptions are examples of how dynamic the world has become.
In my view, this doesn’t eliminate the need for planning.
It creates the need for scenario planning that considers multiple possibilities.
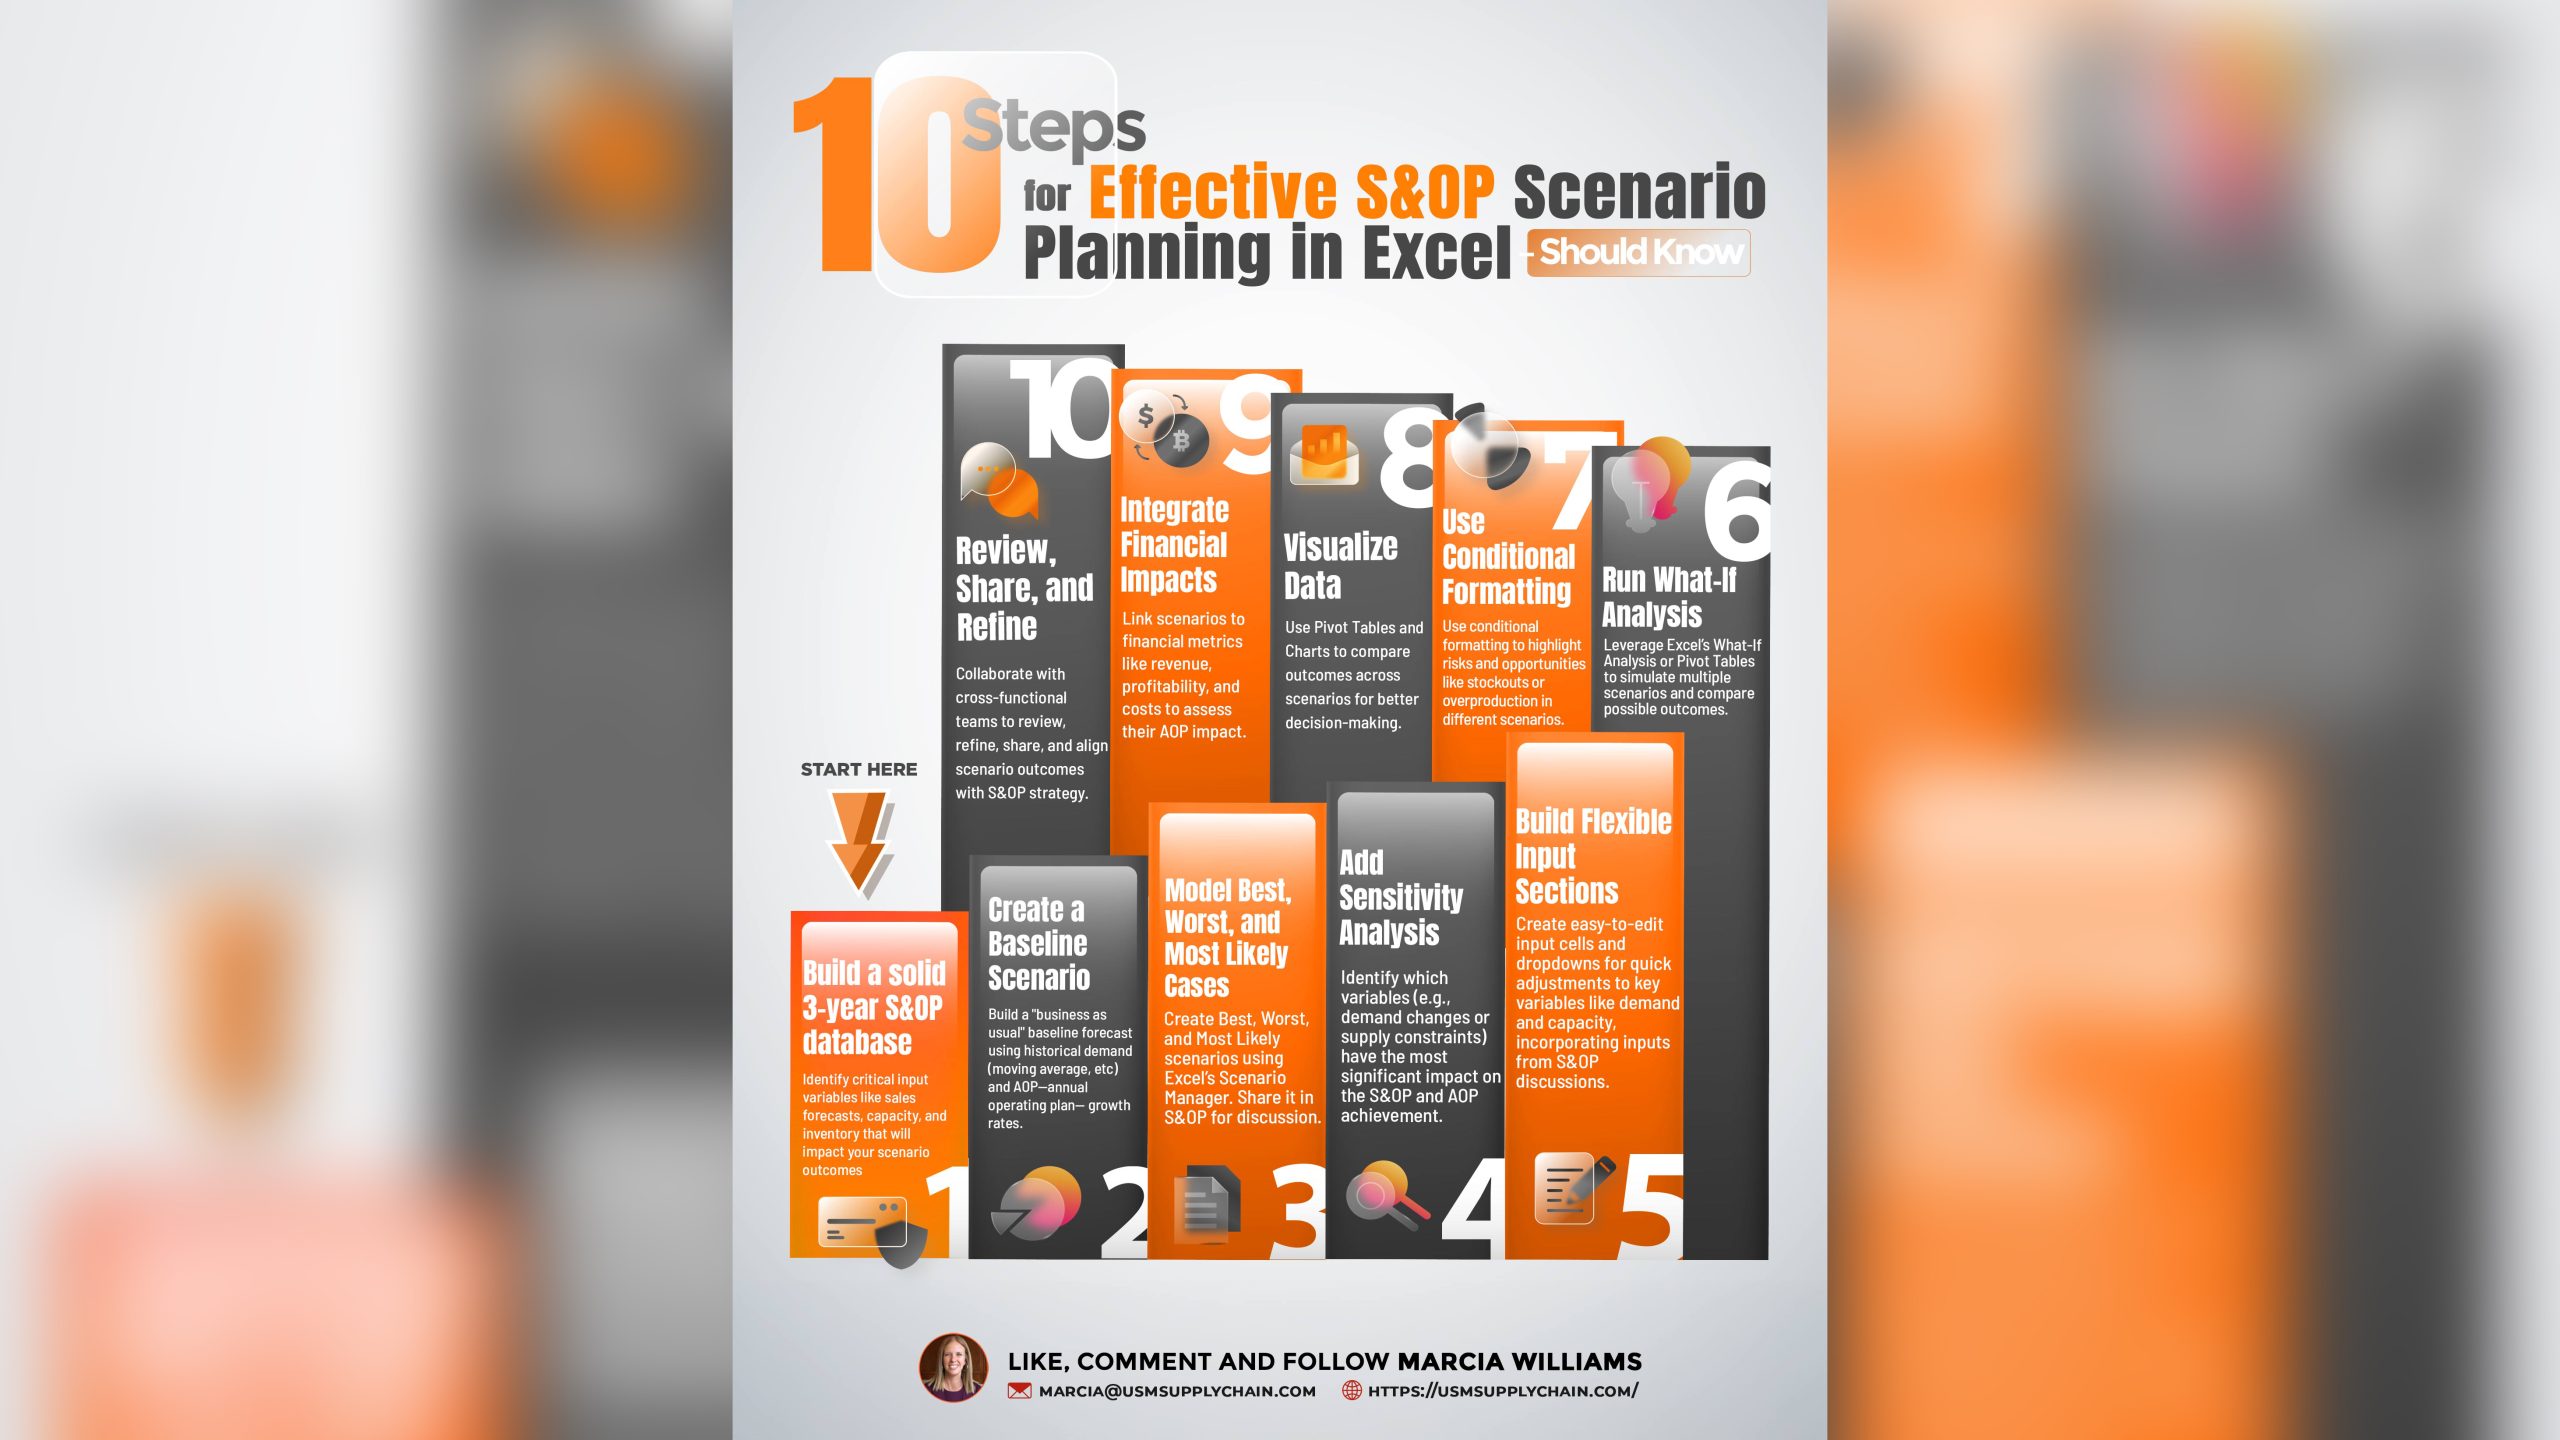
This is a post I made on LinkedIn on how to do scenario planning for S&OP in Excel.
It is a starting point, as most of us are familiar with Excel. Let’s dive in!
Step #1 Build a solid 3-year S&OP (sales and operations planning) database
Start with a reliable foundation.
Gather three years of demand history, inventory records, production capacity, and supplier lead times.
Example: A beverage company consolidates three years of SKU-level sales and seasonality data to forecast summer spikes.
Step #2 Create a Baseline Scenario
Model a “business as usual” forecast using historical trends plus this year’s growth assumptions (Annual Operating Plan targets).
Example: A dairy company builds a baseline with 3% growth based on recent yogurt category expansion.
Step #3 Model Best, Worst, and Most Likely Cases
Use Excel’s Scenario Manager to map optimistic, pessimistic, and realistic outcomes.
Example: A chocolate brand models scenarios where cocoa prices either remain stable (best) or spike by 25% (worst).
Step #4 Add Sensitivity Analysis
Test which variables (like demand swings or production downtime) most impact your numbers.
Example: A cosmetics CPG discovers that even a 5% promo forecast error in Q4 could cause a 15% stockout risk.
Step #5 Build Flexible Input Sections
Design your file with editable input cells and dropdowns so planners can easily tweak demand assumptions, capacity shifts, or lead times.
Example: A household goods brand sets up a dropdown to model different launch dates for a new detergent.
Step #6 Run What-If Analysis
Use Excel’s What-If Analysis or Data Tables to run multiple simulations at once.
Example: A frozen foods company runs a What-If to see the effect of a port strike delaying imported ingredients.
Step #7 Use Conditional Formatting
Highlight stockouts, capacity overruns, or excessive inventory visually with colors.
Example: A baby food brand uses red highlights when DC inventory falls below three weeks’ supply.
Step #8 Visualize Data
Create Pivot Charts to instantly show decision-makers the impact of each scenario.
Example: A juice manufacturer compares profitability by scenario through a clean bar chart showing margin erosion in the worst case.
Step #9 Integrate Financial Impacts
Link operational scenarios directly to revenue, COGS, and margin projections.
Example: A snack foods company ties volume shortfalls to missed revenue targets and increased write-offs.
Step #10: Review, Share, and Refine
Always review scenarios with cross-functional teams (Sales, Marketing, Operations, Finance) before finalizing S&OP decisions.
The best plans are built together!
Doing scenario planning in Excel is a fantastic start.
To build on these capabilities, companies leverage technology.
Advanced planning and scheduling (APS) systems and machine learning (ML) bring even more powerful benefits:
Speed and Scalability
APS platforms like Blue Yonder, Kinaxis, or OMP can simulate hundreds of scenarios in minutes, while Excel can quickly become manual and error-prone at scale.
Automation of Forecast Adjustments
ML models automatically detect demand pattern shifts (example: sudden promo lifts or channel shifts like DTC surges) without manually adjusting every input.
Dynamic Re-Optimization
APS solutions continuously re-optimize plans in real time when conditions change like a supplier delay.
Cross-Functional Visibility
APS platforms integrate data across demand, supply, inventory, and finance into a unified system, so CPG leaders can make decisions faster with aligned views.
Advanced Scenario Planning
ML algorithms can predict probabilistic outcomes (“there’s a 60% chance of a demand surge”) instead of just static best/worst/likely cases, leading to smarter risk management.
Financial Integration at Deeper Levels
Instead of linking a few revenue and cost metrics manually, APS systems connect operational scenarios to full P&L and cash flow models automatically.
With this, we have covered the roadmap for scenario planning, starting with Excel to then take advantage of AI/ ML.


