

If you’re a demand planner or just getting started with forecasting, building a sales forecast can feel overwhelming. Excel is a great tool to accomplish this.
Here’s a simple, actionable, step-by-step guide:
1. Unify Your Data with Power Query
Forecasting starts with clean, unified data.
In Excel, go to Data → Get Data and use Power Query to pull historical sales data from multiple sources (like CSV files or ERP exports).
Power Query is a game changer.
If you would like to go deeper with detailed explanations and screenshots, check out my blog post. I am sure you will love it.
The idea is that instead of manually merging files each month, you set up a query that refreshes automatically.
Example: Pull last two years of sales data for all SKUs from your ERP system.
When new sales close each month, simply click “Refresh” in Power Query and your tables update instantly with the actuals.
By doing so, there are no copy-pasting errors.
2. Build a Time Series Table
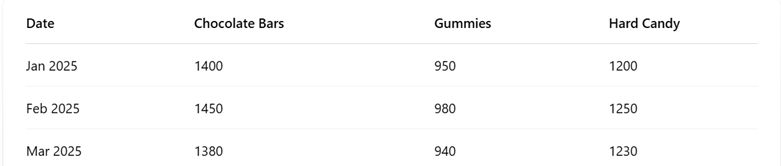
Organize your data into a time series: rows for dates and columns for products or product categories.
Fill the table with actual sales units or revenue.
Example: Create a forecast table where column A is the month (Jan 2025, Feb 2025, etc.), and columns B–Z are individual product families like “Chocolate Bars,” “Gummies,” and “Hard Candy.”
This structure allows quick aggregation and easy comparison of actuals vs. forecasts.
3. Leverage Advanced Statistical Functions
Use Excel’s FORECAST.ETS function for a basic forecast that detects seasonality automatically.
Example: For “Chocolate Bars,” apply =FORECAST.ETS([next month], [sales history], [timeline]) to project future sales.
To handle strong seasonal patterns (like candy sales spiking in October and December), use FORECAST.ETS.SEASONALITY.
This is particularly relevant for companies in the CPG (consumer packaged goods) space.
4. Try Weighted and Exponential Moving Averages
Sometimes smoothing techniques outperform automated functions.
Create a Weighted Moving Average by giving more importance to recent sales months.
Example: Assign weights of 0.5 to the latest month, 0.3 to the month before, and 0.2 to two months prior. This helps if recent trends (like a new customer acquisition) are critical.
Alternatively, Exponential Smoothing can help stabilize erratic data.
5. Check Forecast Accuracy and Bias
After producing forecasts, evaluate their accuracy. This not only helps measure performance but also identifies areas for improvement.
For example, it is important to calculate WMAPE (Weighted Mean Absolute Percentage Error) to measure how far off your forecast is.
Example: If your WMAPE is 12%, it means your forecast is typically off by 12%.
In addition In addition and even more importantly from my point of view, check for Bias. Is the team consistently forecasting too high or too low?
This insight helps correct systemic errors before planning inventory or production.
Mistakes here are very costly.
6. Create a “Scenario” Sheet for Adjustments
Unexpected events like promotions or supply shortages happen all the time.
Build a simple “Scenario Adjustments” table.
Example: Add a cell that says “+20%” for October to account for a planned Halloween promotion.
Link this to your forecast formula so changes auto-update across the forecast.
7. Build an Interactive Dashboard
Finally, dashboards are great for visualization.
Create a dashboard using PivotTables, Slicers, and Charts.
Example: Allow users to make different selections including “Region = West Coast” and “Product Line = Gummies” to instantly see trends and make comparisons.
From my perspective, dashboards are fantastic in S&OP meetings. My preference is having them in PowerBI, with waterfall charts to easily see the changes and identify the drivers.
But, please feel free to start with Excel.
Conclusion:
By following these seven steps, you will be able to create a sales forecast in Excel that will help to start the conversation with the Sales and Marketing teams.


